Visual examples of retinal variables
Visual examples of retinal variables
Retinal variables affected by schizophrenia and other neuropsychiatric disorders conditions.
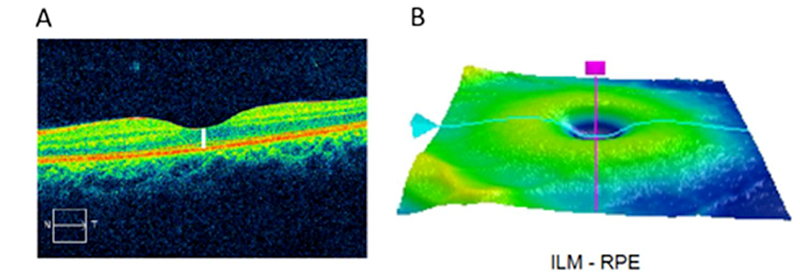
Thinning of macula
The macula is a small region located in the center of the retina that is responsible for central vision. The thickness of the macula is measured as the distance between the internal limiting membrane (ILM) and retinal pigment epithelium (RPE). This area is shown by the added white line in Panel A below. In patients with schizophrenia, reduction of macula thickness and volume have been observed.
 Measurements of the macula
Reduced Microvasculature
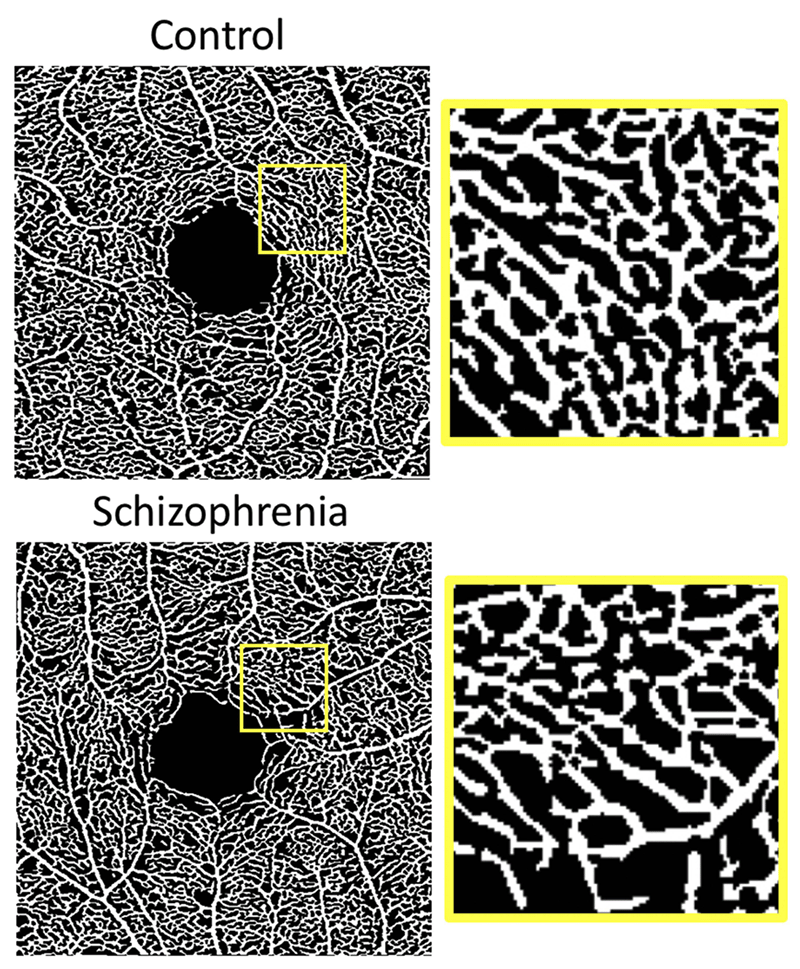
Thinning of retinal vasculature has been observed in patients with schizophrenia. As a result, the foveal avascular zone (FAZ) in the center of the macula increases in size. Loss of retinal vasculature can be seen in the example below (bottom panel) from a person with schizophrenia.
In these binarized images (where vessels above a threshold level of blood flow are represented in white and everything else is black), the portion of the vasculature inside the yellow boxes on the left panels are enlarged as the right panels.
Reduced density of the retinal microvasculature in the parafoveal region can be seen clearly in the schizophrenia example (bottom panels).
Electrical abnormalities
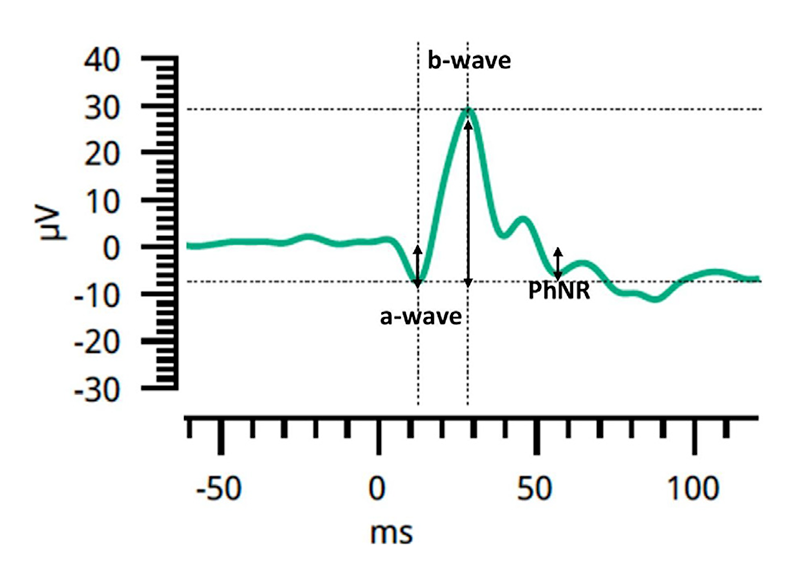
The electrical activity of the retina is measured with electroretinography (ERG). The a-wave of the ERG reflects the hyperpolarization of photoreceptors, and the b-wave reflects the depolarization of Muller and bipolar cells.
The photopic negative response (PhNR) reflects activity of regional ganglion cells, and can be elicited in specific stimulus conditions. In schizophrenia patients, there is frequent reduction in b-wave amplitudes and, in some studies, attenuated (i.e., less negative) a-wave and PhNR amplitudes.
 Typical ERG waveform response
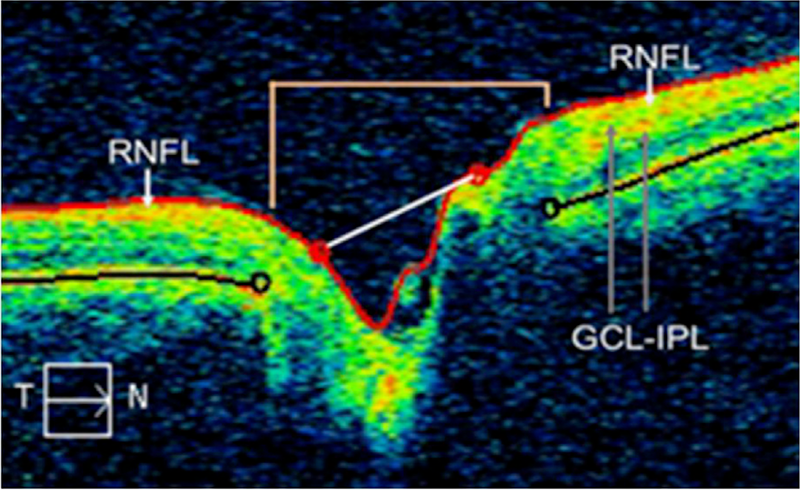
The red line represents the RNFL
Thinning of the retinal nerve fiber layer (RNFL)
The RNFL is composed of the axons of the retinal ganglion cells which form the optic nerve as they exit the eye. Thinning of the RNFL has been observed in schizophrenia patients. This can be measured both at the peripapillary region (adjacent to the optic disc, as shown below), or the macular region (i.e., adjacent to the macula). The image above also shows the layers adjacent to the RNFL (the ganglion cell body layer (GCL) and the inner plexiform layer (containing dendrites of the ganglion cells and their synapses with bipolar cells and amacrine cells).
This image also shows the boundaries of the optic disc (indicated by both the brown lines and the black circles), and the width of the optic cup (indicated by the red points at the end of the white line. The cup-to-disc ratio can serve as an additional measure of degeneration of retinal neural tissue at the optic disc, with larger values indicating greater neurodegeneration. This ratio has been found to be enlarged in people with schizophrenia in some, but not all, studies.